Forensic 3D Animation & Crash Simulation
Forensic 3D Animation & Crash Simulation
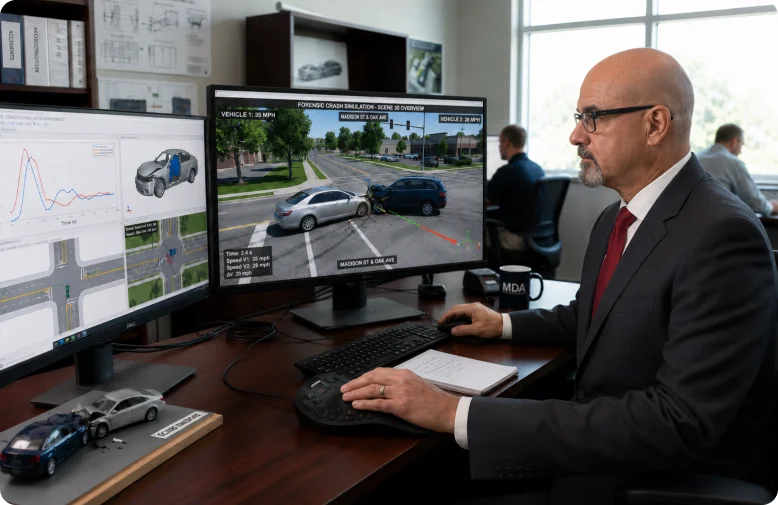
Gerald McDevitt develops Gerald McDevitt develops forensic 3D animations and crash simulations based on measured data, physical evidence, and accepted reconstruction methods. These visualizations represent vehicle movement, impact dynamics, and the sequence of events as the analysis establishes them.
Each animation is built from the same data used in the reconstruction analysis, so what is shown can be traced back to the measurements it came from.
Clear Visual Communication for Attorneys, Insurers & Investigators
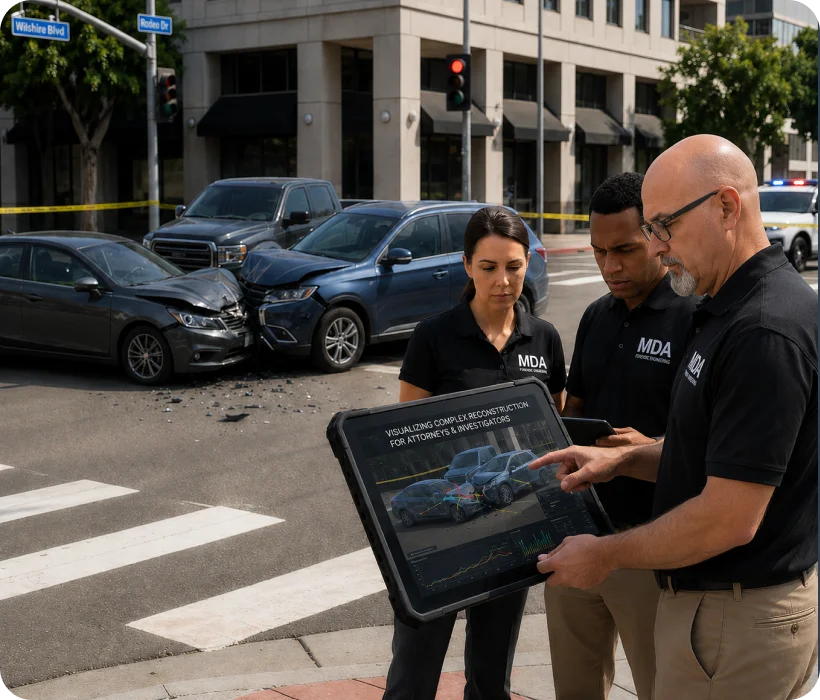
Technical reconstruction findings can be difficult to follow in a written report alone. Gerald McDevitt translates the analysis into visual form, showing vehicle paths, timing, and impact conditions so attorneys, judges, and juries can follow what the evidence establishes. Every visual is tied to the underlying data, and anything not established by the data is left out.
Applications of 3D Reconstruction
Collision Reconstruction Animations
Visual representation of the collision sequence based on measured data and reconstruction analysis, including vehicle paths, impact locations, and final rest positions.
Crash Simulation Modeling
Simulation of vehicle dynamics under specific impact conditions, used to test reconstruction conclusions against measured data and to evaluate alternative scenarios proposed by opposing experts. Momentum analysis is performed in FARO Zone 3D Expert Plus using its in-line and 360-degree momentum tools and the MassZone prediction tool.
Courtroom Demonstratives
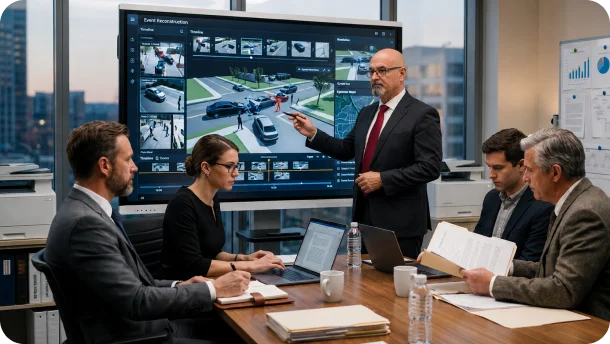
Animations developed specifically for trial presentation, designed to clearly support expert testimony and assist in explaining complex findings to judges and juries.
Timeline & Sequence Visualization
Step-by-step visual breakdown of the collision sequence, showing timing, movement, and key events leading up to and following impact.
Integrated Reconstruction Visuals
Animations that combine scene mapping, vehicle data, and reconstruction findings into a unified visual presentation aligned with all available evidence.
Accuracy, Validation & Evidentiary Support
Every animation is based on documented reconstruction analysis rather than visual approximation. Parameters such as speed, distance, timing, and motion are derived from measured data and accepted methods.
The basis for each parameter is documented, so the animation can be examined on cross-examination against the data it was built from.
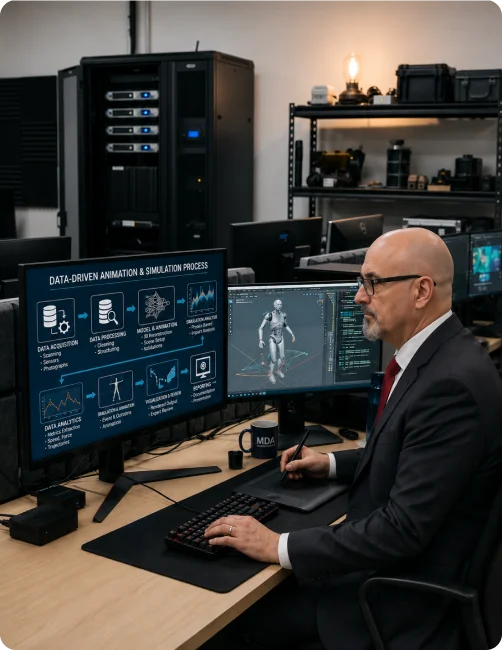
Data-Driven Animation & Scientific Methodology
All animations are developed using reconstruction data derived from scene measurements, mapping, and vehicle analysis. Data sources may include Emlid Reach RS3 GNSS, a Sokkia reflectorless total station, Recon3D handheld LiDAR documentation, Autel EVO II Pro RTK V3 drone photogrammetry, and high-resolution digital imaging.
Each animation reflects measurable conditions and is checked against the physical evidence.
Prepared for Deposition & Trial
All animations are developed as demonstrative exhibits to support expert testimony. Visual outputs are structured to clearly illustrate findings without overstating conclusions, maintaining alignment with the underlying data.
Gerald McDevitt presents these visualizations in a clear and structured manner, and explains the limits of what each one shows.
Request 3D Animation or Simulation Support
Discuss case details directly to determine whether animation or simulation will assist in presenting reconstruction findings effectively.